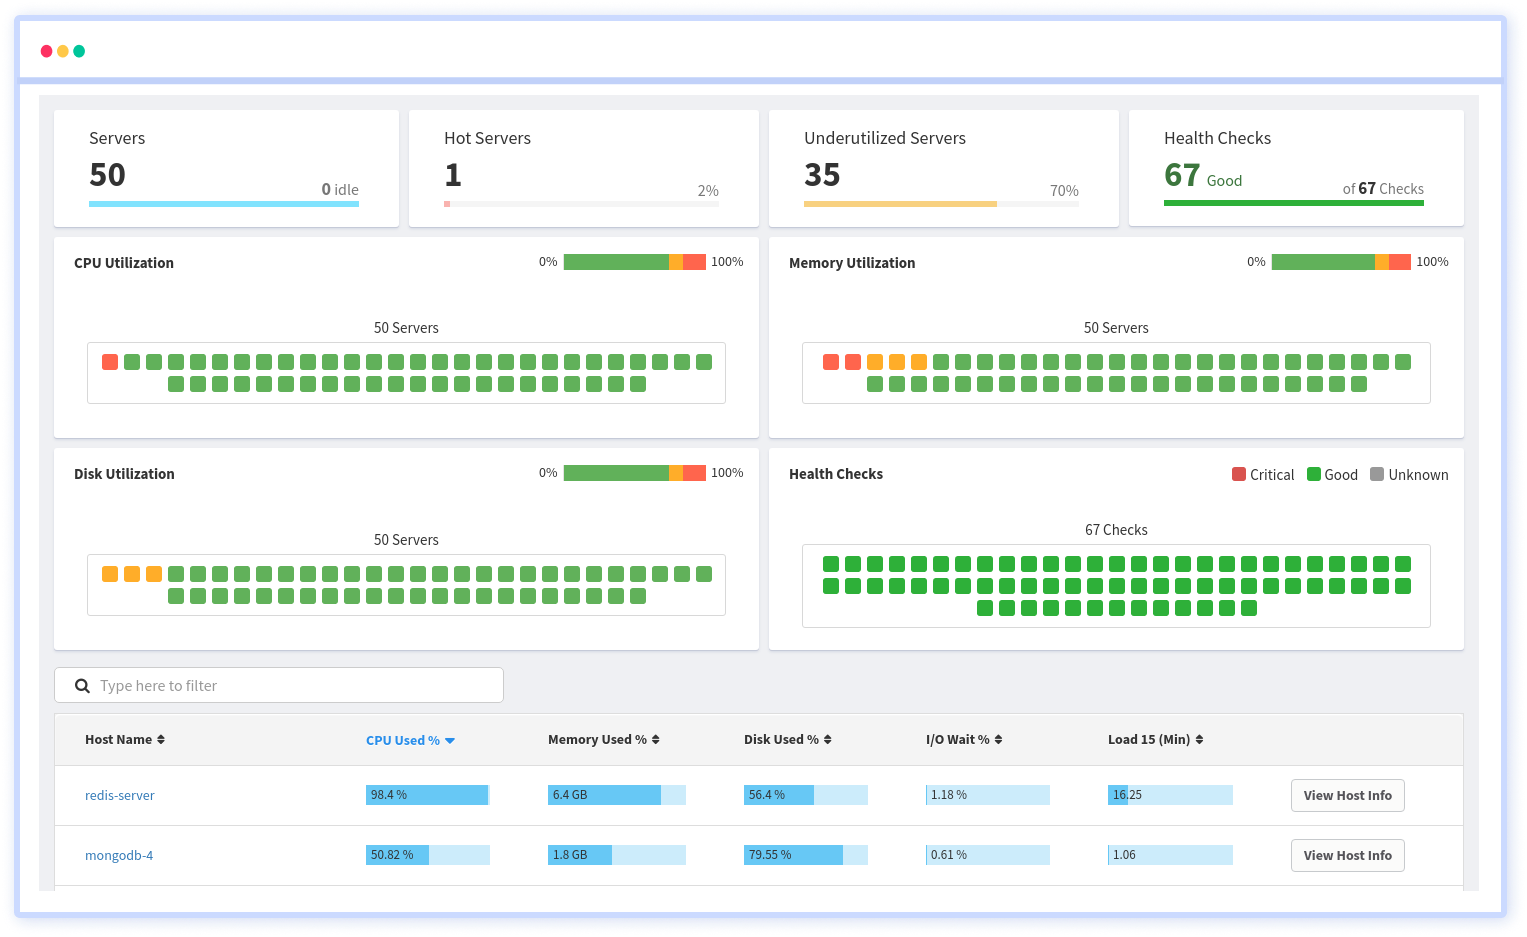
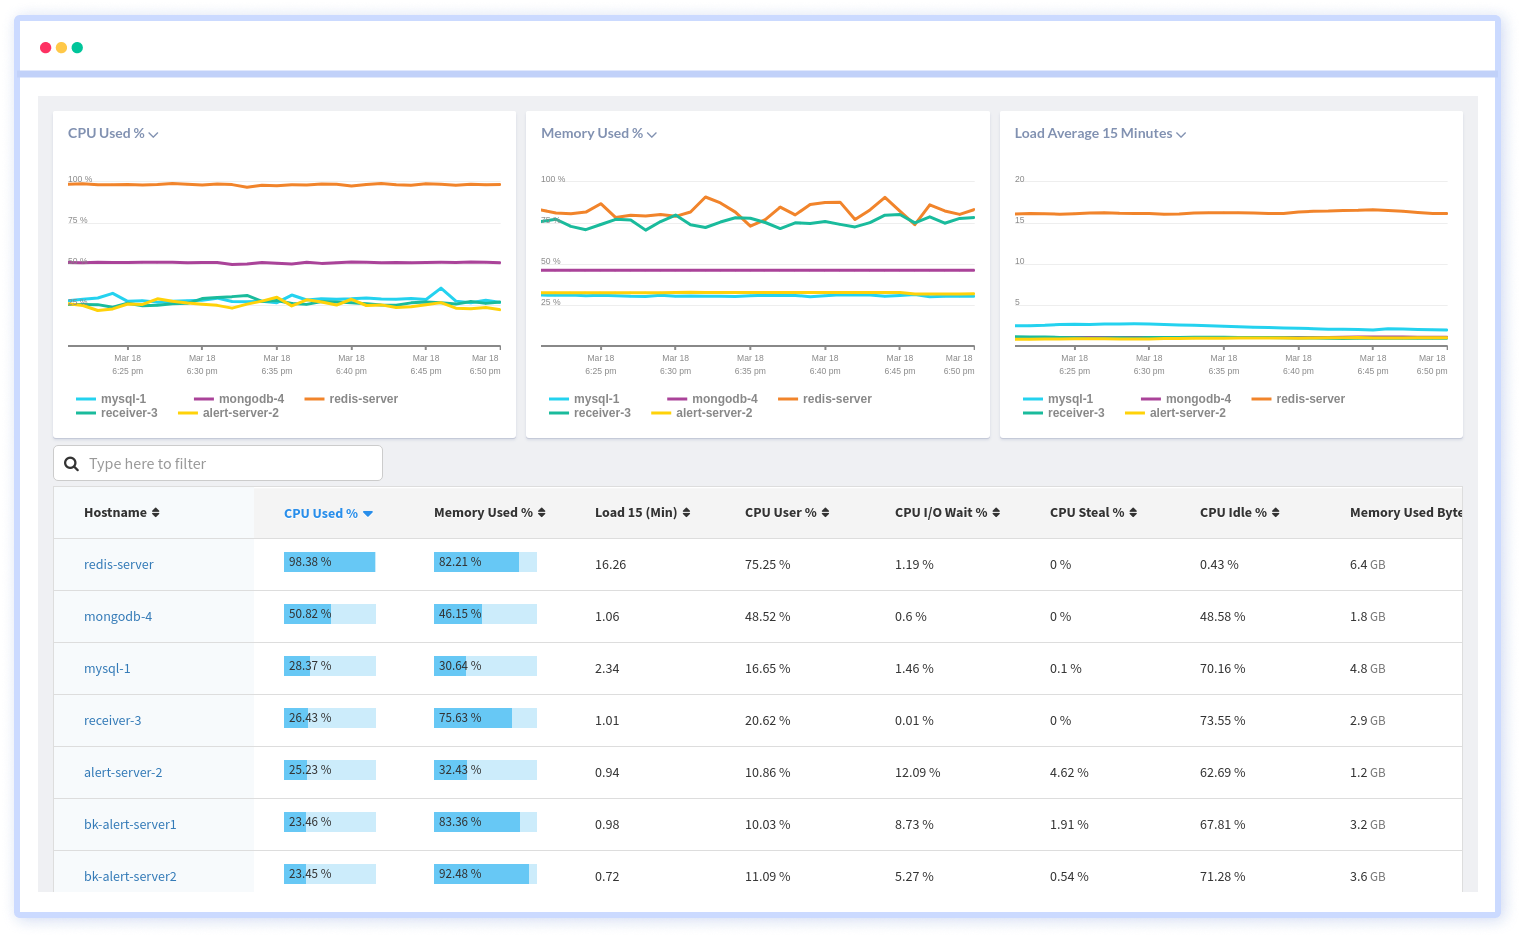
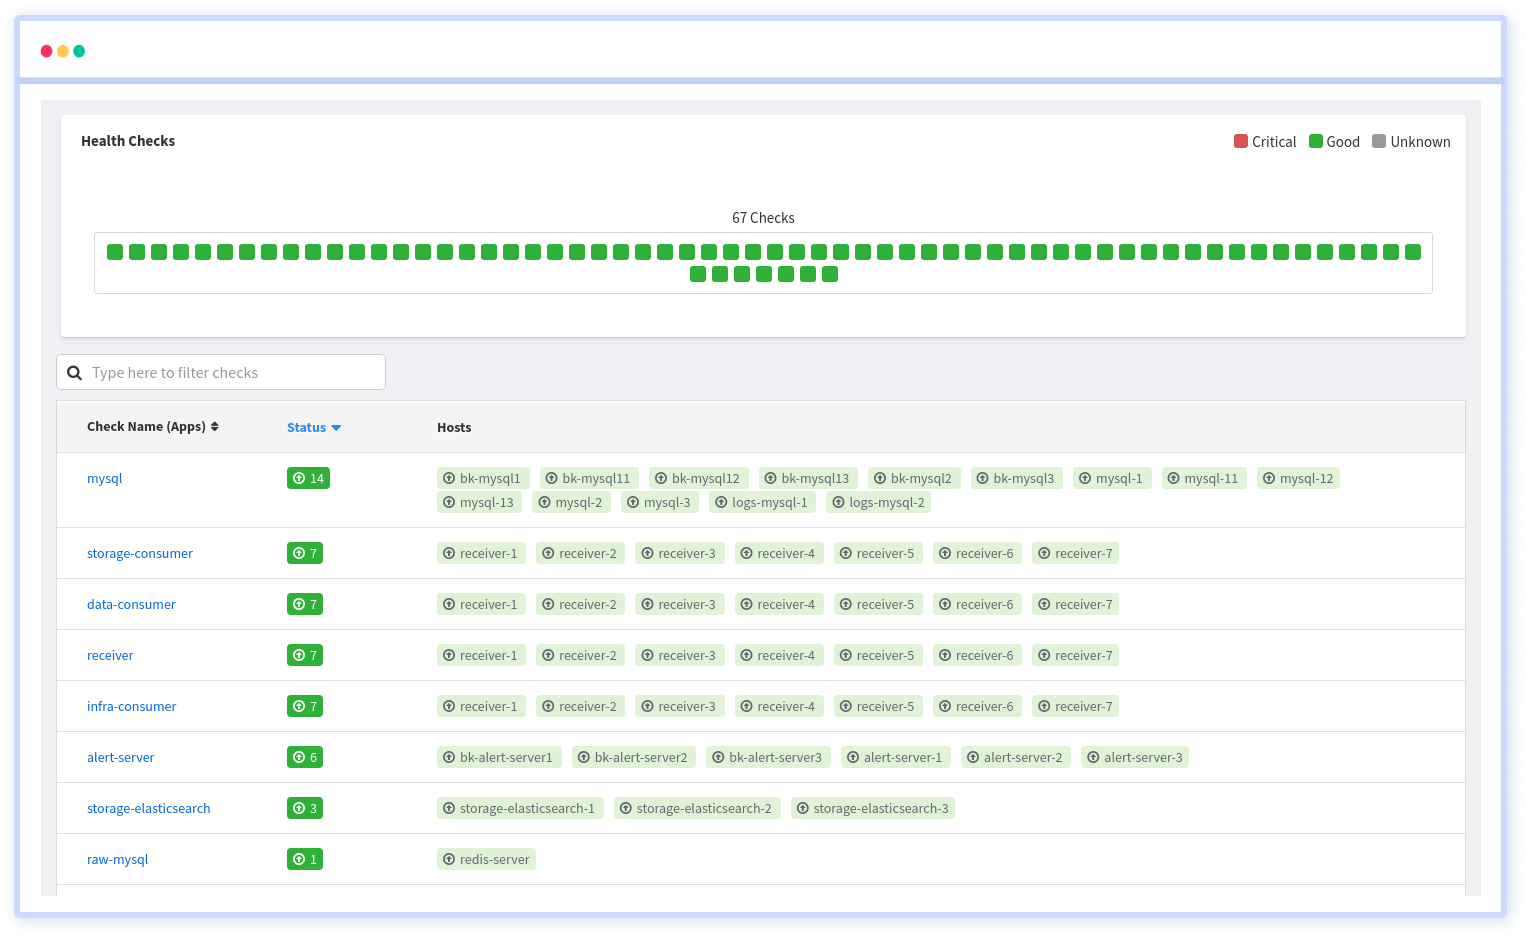
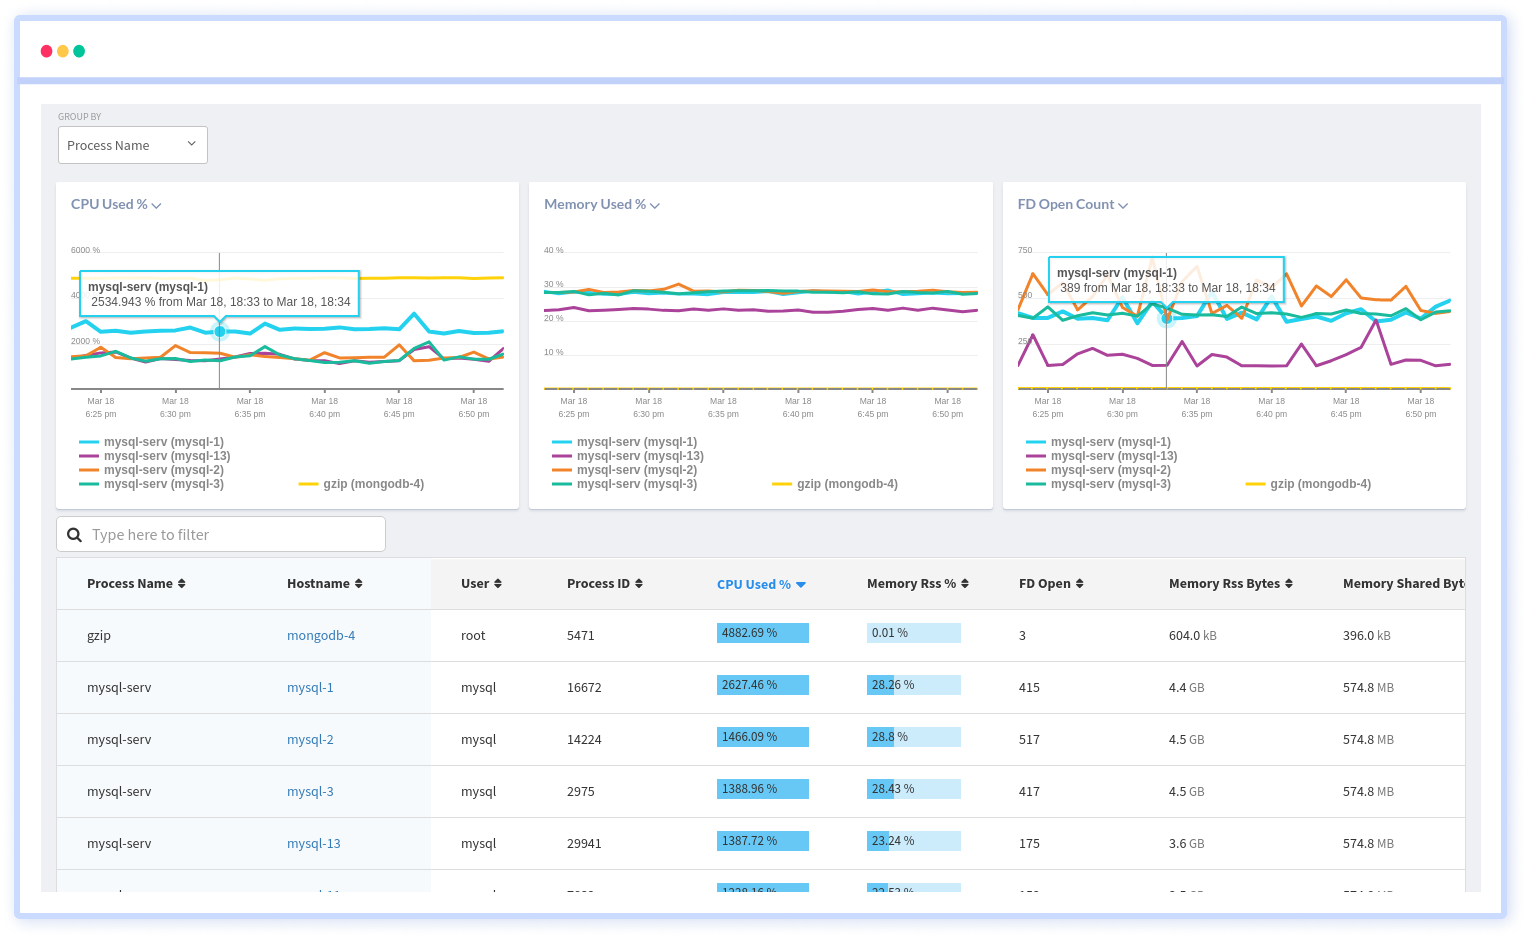
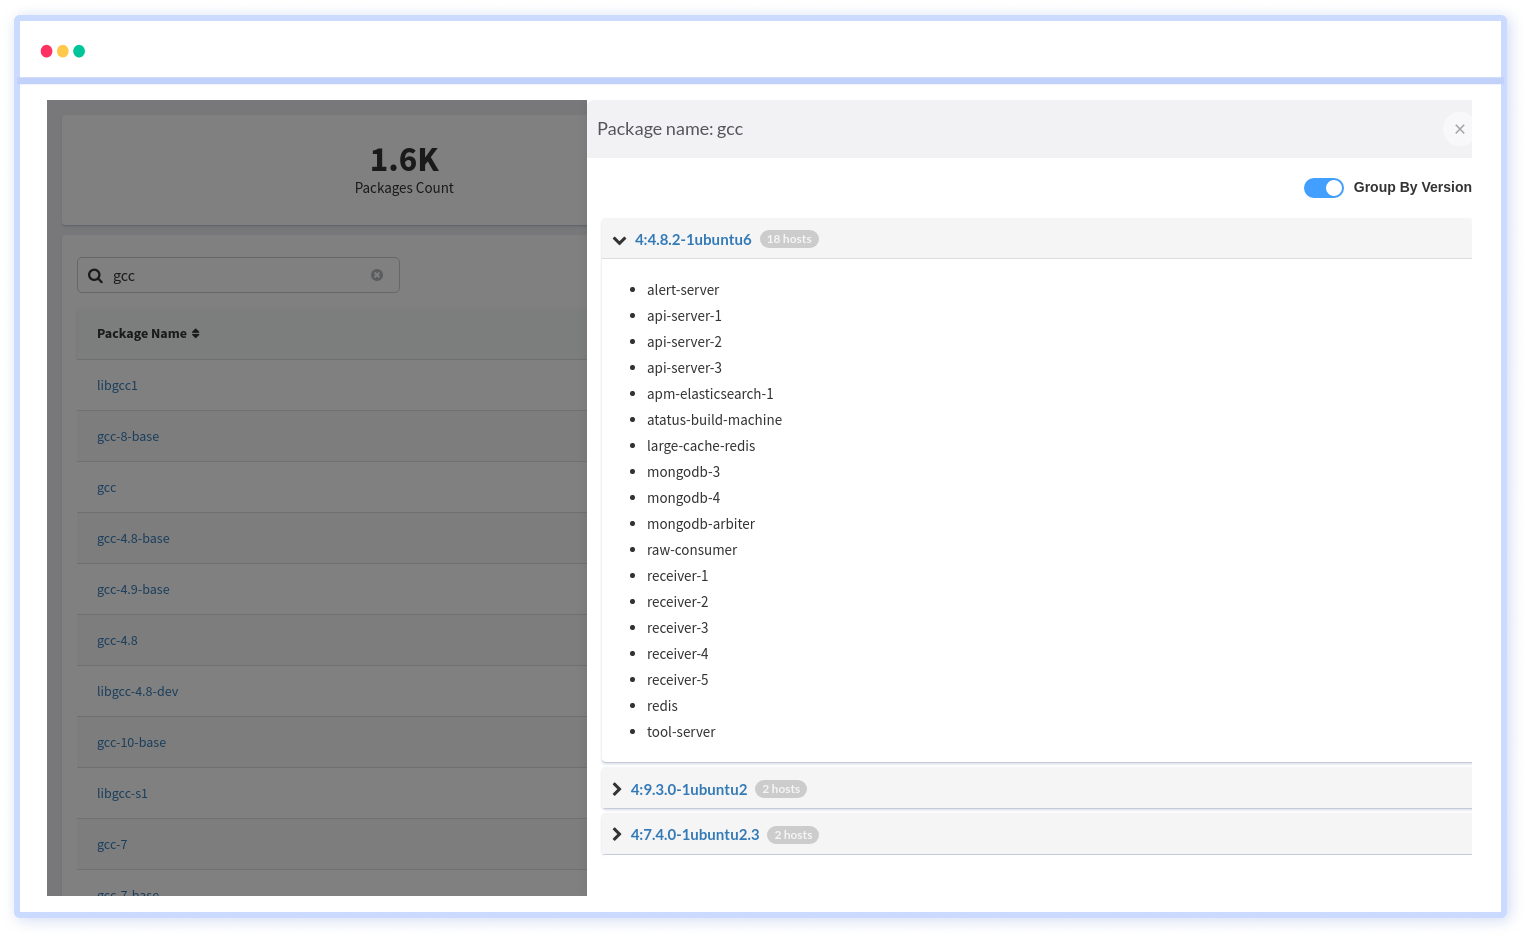
Get complete visibility of your infrastructure to diagnose and resolve performance issues that impact your business. Make better business decisions by correlating application metrics, logs and traces to troubleshoot problems faster.

Get an enhanced overview of your servers and containers, with a summary of CPU, memory, disk, network utilization in a single view.
Set up health checks to monitor health (uptime) of apps or services running on your servers. Get notified on any impact to the services.
See the summary of all your resources per process, including CPU, memory, storage and network, with detailed data for troubleshooting issues.
Search, filter and group packages, inventory data to identify security vulnerabilities, mismatches, and any user action on your servers.
Get real-time insight into the utilization of your servers or cloud instances. Monitor all key infrastructure performance metrics of your hosts including CPU, memory, i/o, disk, network, load averages and see the trends for all your servers.

Set-up health checks to check availability and basic performance metrics for applications services to reduce downtime and resolve issues. Get it integrated with indecent management systems e.g. JIRA, PagerDuty, VictorOps and more. Replace Nagios or Consul with an integrated health check solution.

Get an in-depth overview of the processes or services that are causing high system usage. Dig deeper to understand the load on the system resources to determine which process is causing the slow down, how it is using the available resources, where optimizations can be done.

View all package modifications, installations, updates, removals on your servers. Group and filter them to determine which packages are vulnerable, needs to be updated and the overall status across your servers with real-time server performance monitoring.

Deploy and get started within minutes in seeing key server performance metrics for actionable insights. Just start collecting data and solving issues now.
Troubleshooting becomes easier if you are able to correlate the host metrics with the APM slow traces and errors. Get connected context with unified monitoring.
Setup alerts to automatically monitor your infrastructure for downtime, increase in CPU, memory, disk and storage consumption. Get notified through various channels, including Slack, Teams, Email, PagerDuty and more.
Get your questions answered. Create tags for your hosts and group them together, to slice and dice the data by process, CPU, Memory, disk, network and more.
Billions of data points are processed by us every day. As you grow, we can meet all the demands of your company around the world.
Get fast, 1-on-1 support and training. With live in-app chat and a dedicated customer support team, we are here to help with anything.
You don't have to trust our word. Hear what our customers say!
Atatus is a great product with great support. Super easy to integrate, it automatically hooks into everything. The support team and dev team were also very helpful in fixing a bug and updating the docs.
Atatus is powerful, flexible, scalable, and has assisted countless times to identify issues in record time. With user identification, insight into XHR requests to name a few it is the monitoring tool we choose for our SPAs.
Atatus continues to deliver useful features based on customer feedback. Atatus support team has been responsive and gave visibility into their timeline of requested features.
Try Atatus's features free for 14 days. No credit card required. Instant set-up.