Get full visibility of your application performance in real-time along with in-depth transaction details, slow database queries, poor performing network calls, and more. Atatus helps you in finding root causes and fixing issues faster.

Atatus makes application monitoring easier with actionable insights, so you can isolate and resolve application performance issues holistically.
Drill down into transactions and visualize where your application is spending its most of time.
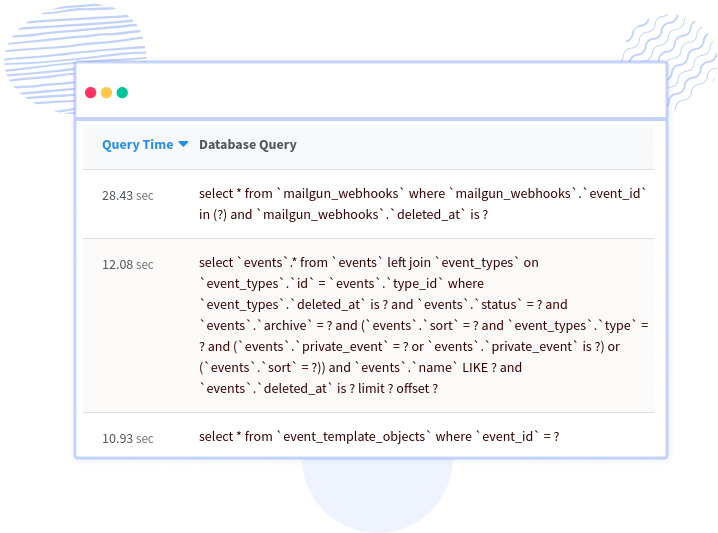
Find and resolve slow database queries quickly in your complex architecture schema.
Look into the group of network calls that affect your request time and throughput specific to that individual request.
Start seeing hidden API failures in minutes that were happening in your application.
Stay ahead of difficult-to-find issues by viewing the breakdown of the code.
Quickly identify Actionable insights to resolve performance bottlenecks and exceptions.
Start tracking releases, ship with confidence and see how each deployment to production impacts your end-users.
Immediately identify high-priority production incidents on your favorite notification system.
View logs, infrastructure metrics, VM metrics in context with the original request.
Get a complete picture of your requests to drill down in finding the slowest layers that are having an impact on your customers. With Transaction Monitoring, troubleshoot request performance issues using histogram and percentiles along with error rate. Find out the slow api responses and resolve them as quickly as possible.
Learn more
See detailed overview of your database performance, slow database queries and the ability to filter and view the original trace specific to that slow SQL query using Database Monitoring. View individual database breakdown and the throughput, to identify any degradation in the database response time.
Learn more
Have visibility into performance of the calls to external services such as third party apps, microservices, and other network calls. See the most time consuming network calls performance and the requests that are most affected by it.
Learn more
Quickly view highest HTTP failure and get each request information along with custom data to identify the root cause of the failures. See the breakdown of the API failures with HTTP Failure Monitoring based on HTTP Status Codes and the end-users having the highest impact.
Learn more
Break down slow request traces by time spent in code blocks, database queries, external services, templates, message queues and much more. View logs, infrastructure metrics, VM metrics in context with the original request.
Learn more
Spot out errors with Error Monitoring. See the full picture of any exception with in-depth diagnostics that lets you know exactly what went wrong and how to fix it. Get all the data you need in one place including stack trace, request parameters, environment, affected users, host, and more.
Learn more
Add deployment markers to measure how your customers are experiencing the recent code pushed into production. See how your application was performing before and after deployment using deployment tracking with the list of slowed down requests, new errors and much more.

Start a 14-day free trial. No credit card, no code changes, no hassle.
Crazy Easy Install, Fast Time to Value
— Aaron F, Product Manager, Resolute Property Tax Solutions
Utilize industry-leading integrations with libraries and frameworks for in depth invisibility into Java, PHP, Node.js, Ruby, Python applications.
See data from multiple apps in real time and visualize critical information including transaction performance, error rate, database performance, network calls and more.
Quickly identity error and performance issues and fix them by using the context, environment, and more before it affects your customers.
Track all your applications in one place. Add your production, dev, staging, QA to monitor your applications through the complete software development cycle.
Get your questions answered. Use custom queries to slice and dice the data by transaction, URL, error, user, browser, host OS and more.
Designed by developers, for developers and managers to determine when and where your attention is required and enable teams to ship more and fix less.
Setup alerts to automatically monitor your applications for increase in response time, API failures, or error rate and much more. Get notified through various channels, including Slack, Teams, Email, PagerDuty and more.
Easily compare one time range to another and so on, and identify changes in app behavior and stability with respect to the app releases.
Don't miss out on your application performance and error stats. Atatus can send you weekly and monthly summaries directly to your inbox.
You don't have to trust our word. Hear what our customers say!
Atatus is a great product with great support. Super easy to integrate, it automatically hooks into everything. The support team and dev team were also very helpful in fixing a bug and updating the docs.
Atatus is powerful, flexible, scalable, and has assisted countless times to identify issues in record time. With user identification, insight into XHR requests to name a few it is the monitoring tool we choose for our SPAs.
Atatus continues to deliver useful features based on customer feedback. Atatus support team has been responsive and gave visibility into their timeline of requested features.
Try Atatus's features free for 14 days. No credit card required. Instant set-up.