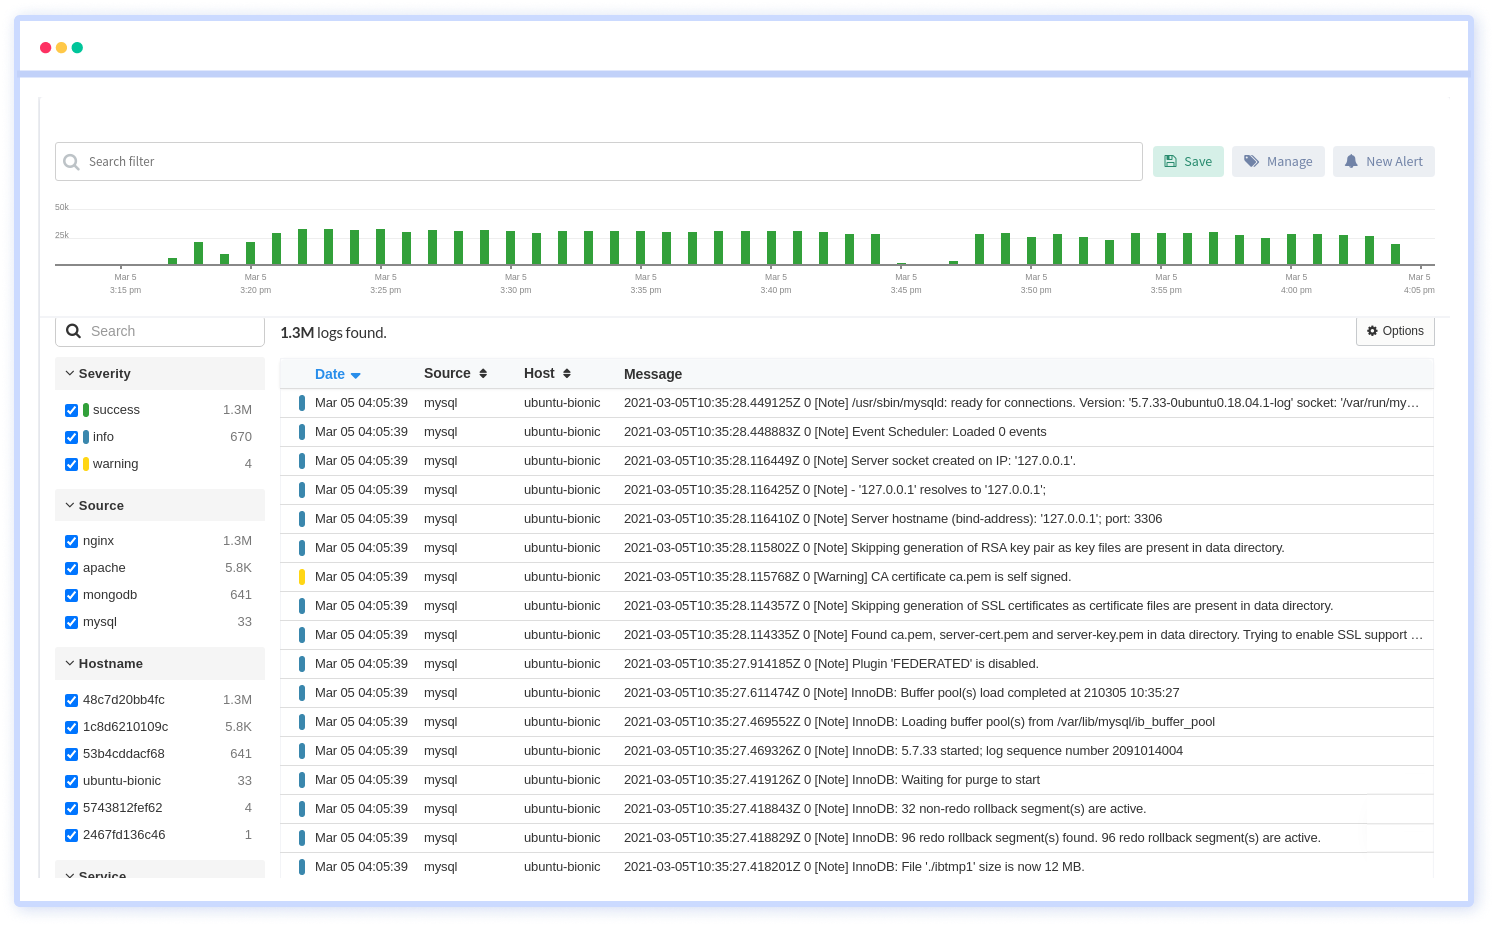
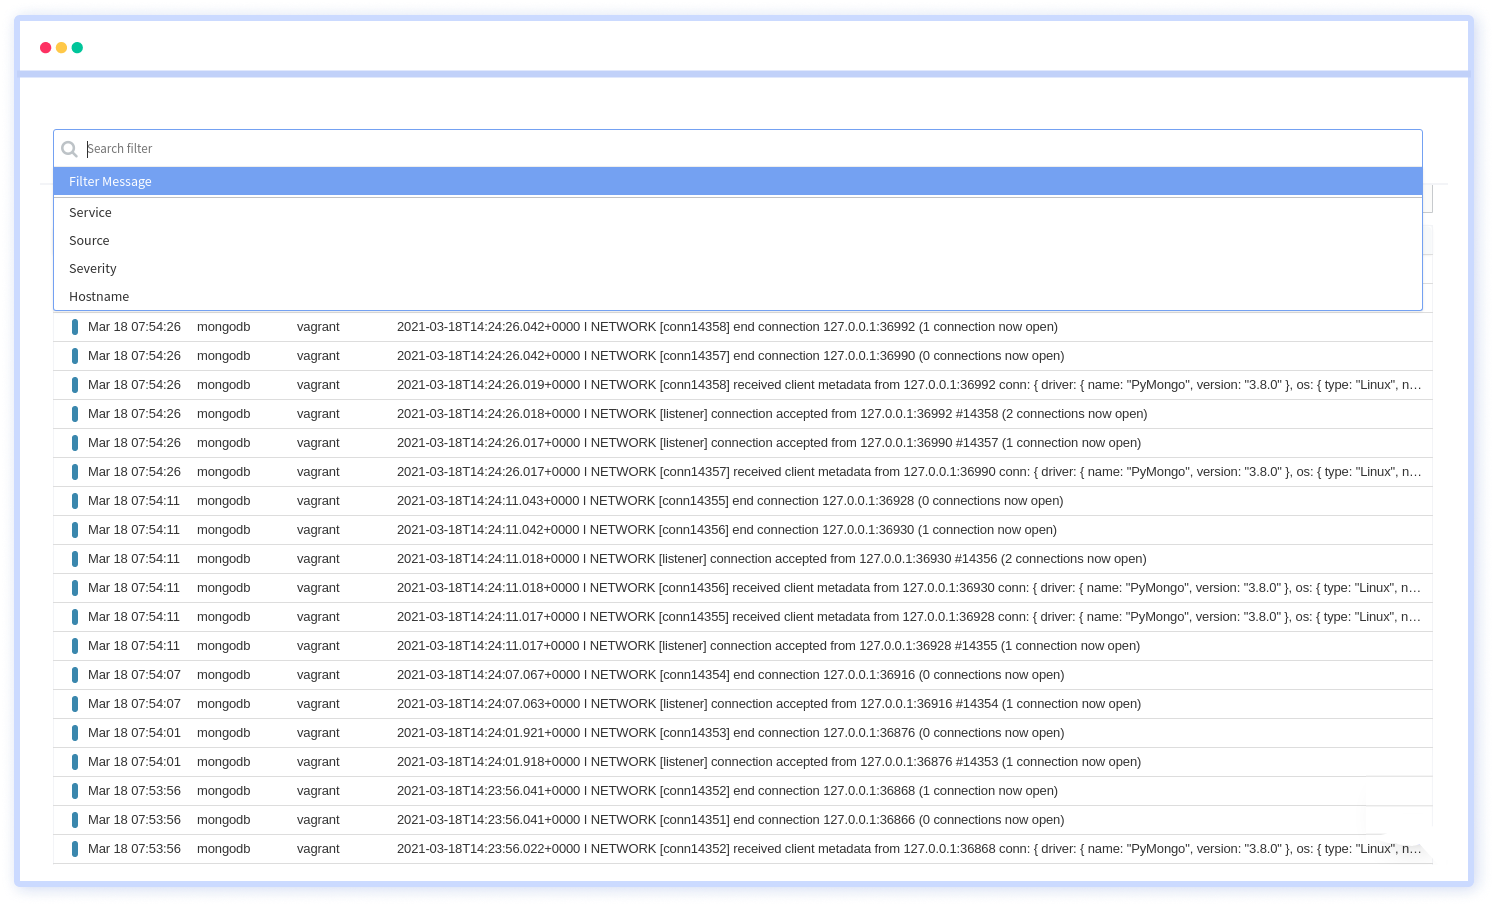
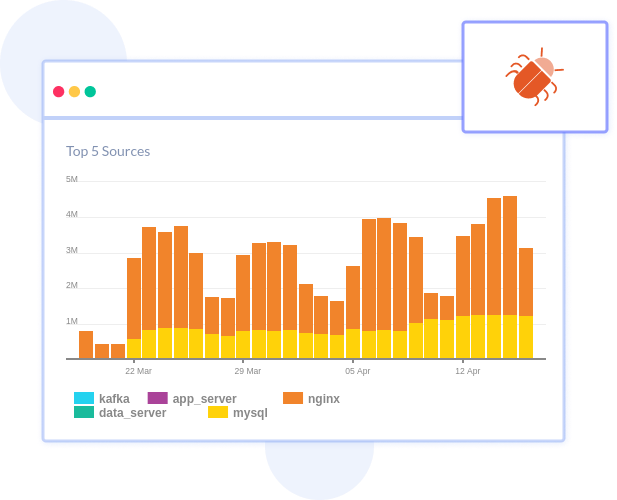
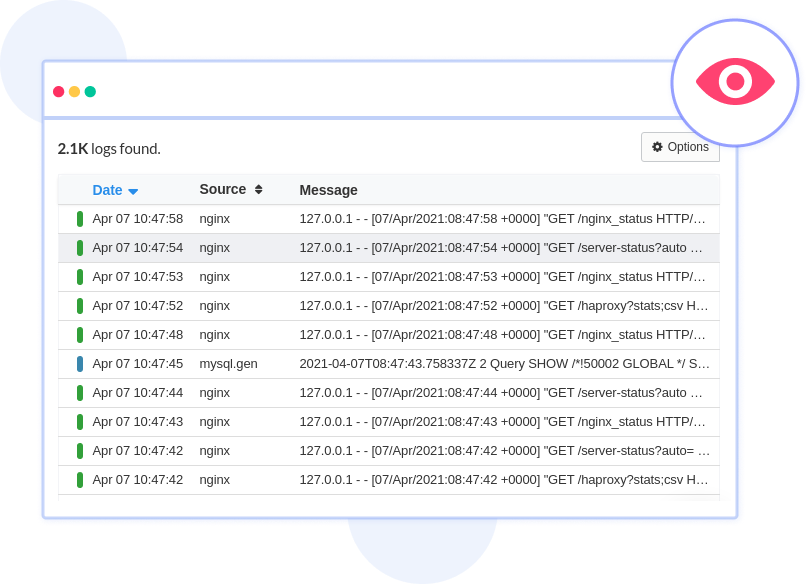
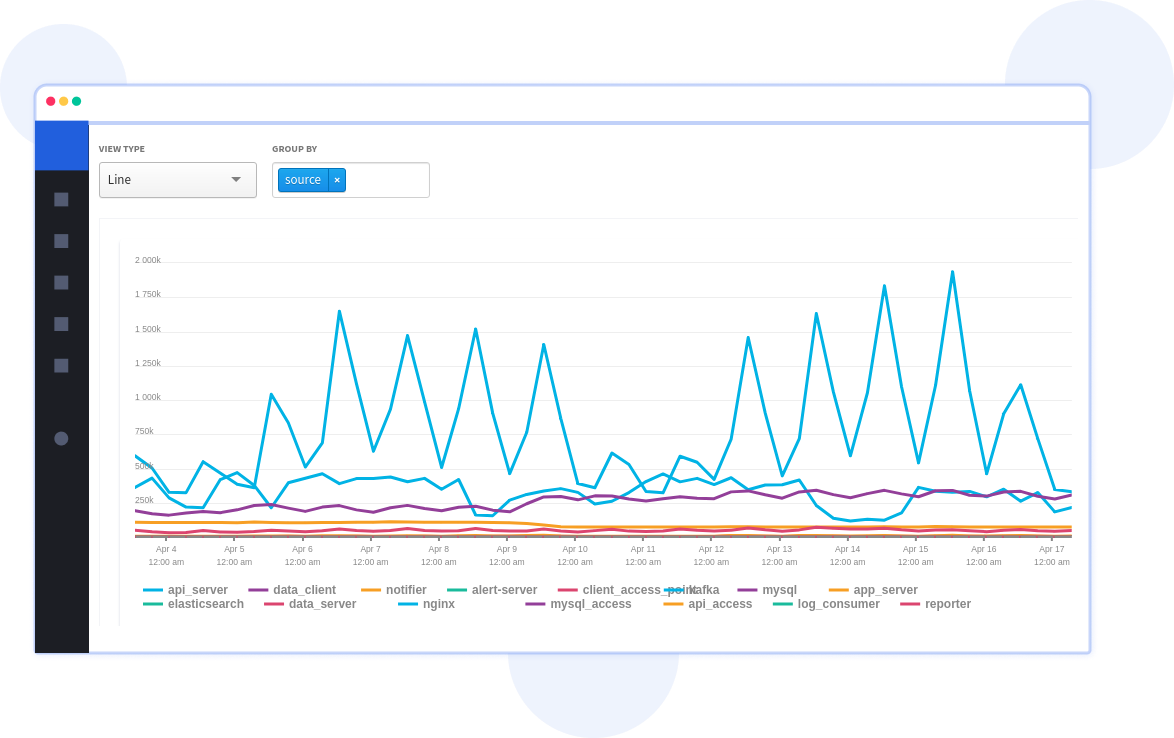
Log management delivered as a fully managed cloud service. Minimal set up, no maintenance, any scale. so you can focus on your business rather than maintaining data pipelines.

Troubleshoot faster by aggregating logs from all of your systems and applications to a centralized, easy-to-navigate user interface.

Get a complete visibility across your complex architecture, as we provide a cost-effective, scalable approach to centralized logging. Process all your logs, generate metrics, visualize log data all from one central place.

Troubleshoot your logs in the production environment by searching, filtering, and analyzing logs on the fly as they come in. Start tailing similar to "tail -f" across systems from a single UI.

Troubleshooting becomes easier if you are able to correlate the log events with the APM slow traces and errors. Get more insights and resolve issues faster.

Slice-and-dice data across log events with easy to use filters. Find the logs by hostname, service, source, messages and more to cut through the noise and focus on the critical events that matter.

Try it free. No credit card required. Instant set-up.
Best Monitoring tool
— S Herman Kiefus, DevOps Admin, Compass
Control retention of the log messages and move older logs to cost effective storage tiers. Don’t pay the same for all logs - so you don't have to pay the same for logs you access less frequently.

Identify trends, analyze messages, troubleshoot problems by providing a quick visualization of log data. It helps in determining patterns or anomalies, speeding up the time to troubleshoot issues.

We automatically archive Logs in your desired external storage like Amazon S3 in a predescribed JSON format along with metadata. You can import them back to analyze it again.

High-priority incidents are notified immediately. You can configure advanced alerts based on error logs, custom queries or trigger conditions. This makes you aware of certain messages that show up in your logs.
When parsing the log events, you can add or delete related streams such as host, service, source, severity. Filtering by context is helpful when you are debugging to jump into that context for further analysis.
Quickly jump to a specific time in your logs across systems, to see exactly what has happened at a given time in your application. Being a distributed architecture, seeking by time is critical to get the complete picture when you are resolving issues.
Save a search to quickly re-run that particular pattern on your log events. Use managed views to add, delete, modify the search filters, all within the event viewer.
Designed to help developers and managers determine when and where their attention is required and enable teams to make fast.
Don't miss out on your events and error stats. Atatus can send you weekly and monthly summaries directly to your inbox.
You don't have to trust our word. Hear what our customers say!
Atatus is a great product with great support. Super easy to integrate, it automatically hooks into everything. The support team and dev team were also very helpful in fixing a bug and updating the docs.
Atatus is powerful, flexible, scalable, and has assisted countless times to identify issues in record time. With user identification, insight into XHR requests to name a few it is the monitoring tool we choose for our SPAs.
Atatus continues to deliver useful features based on customer feedback. Atatus support team has been responsive and gave visibility into their timeline of requested features.
Try Atatus's features free for 14 days. No credit card required. Instant set-up.